Twelve topics, twelve different ways to see them.Every example below uses the tool's own command instructions, verbatim, only the topic is ours
Each card shows the exact command, the topic used, and the underlying prompt the tool assembles internally (Turn "{topic}" into a {command}. {command instructions}), the same template Visual Explainer Studio uses for every generation. Two of these, Dashboard and SWOT Analysis, are the tool's own newest commands, added in its latest update. Want to generate these twelve yourself? The companion image generator runs these exact prompts against your OpenAI key.
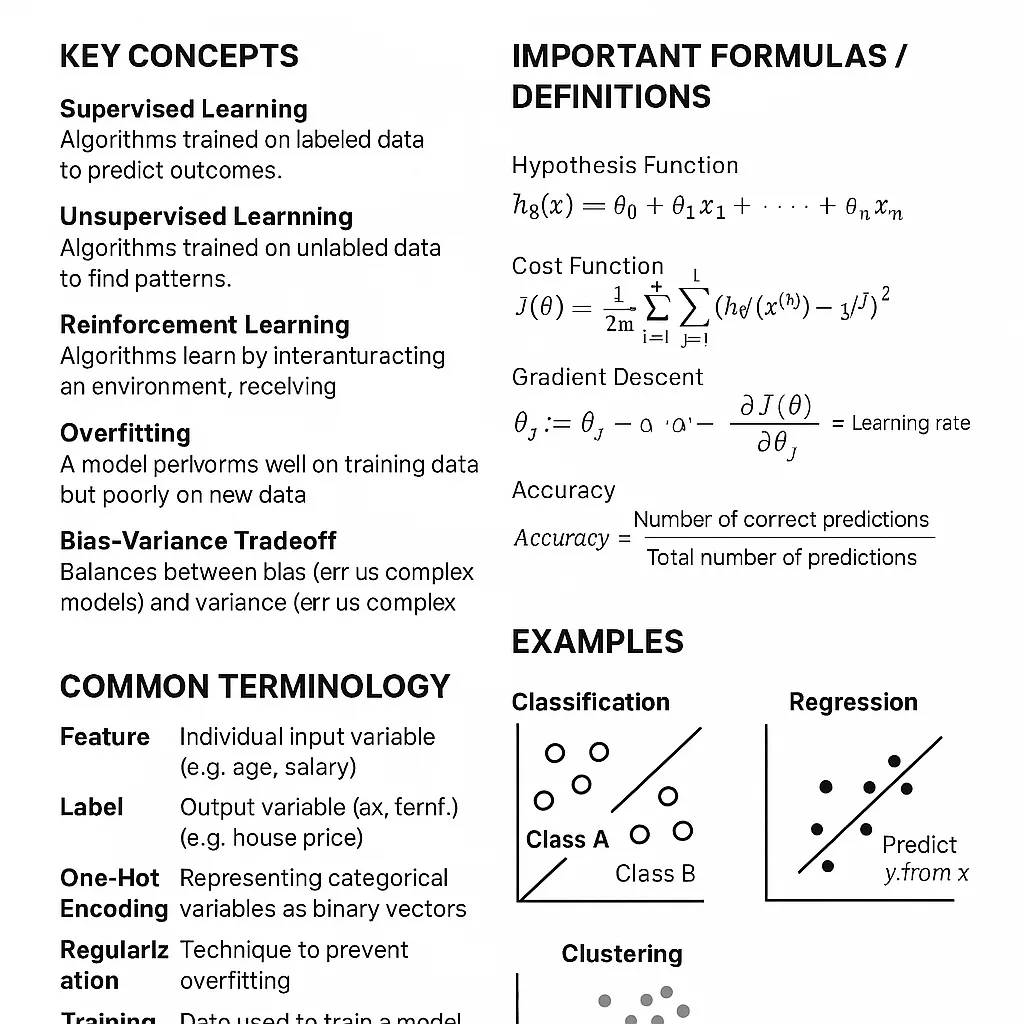
Cheat Sheet
Topic: Machine Learning, key concepts, formulas, terminology, quick examples, one page.

Mind Map
Topic: Artificial Intelligence, central concept, branching subtopics, labeled connections.
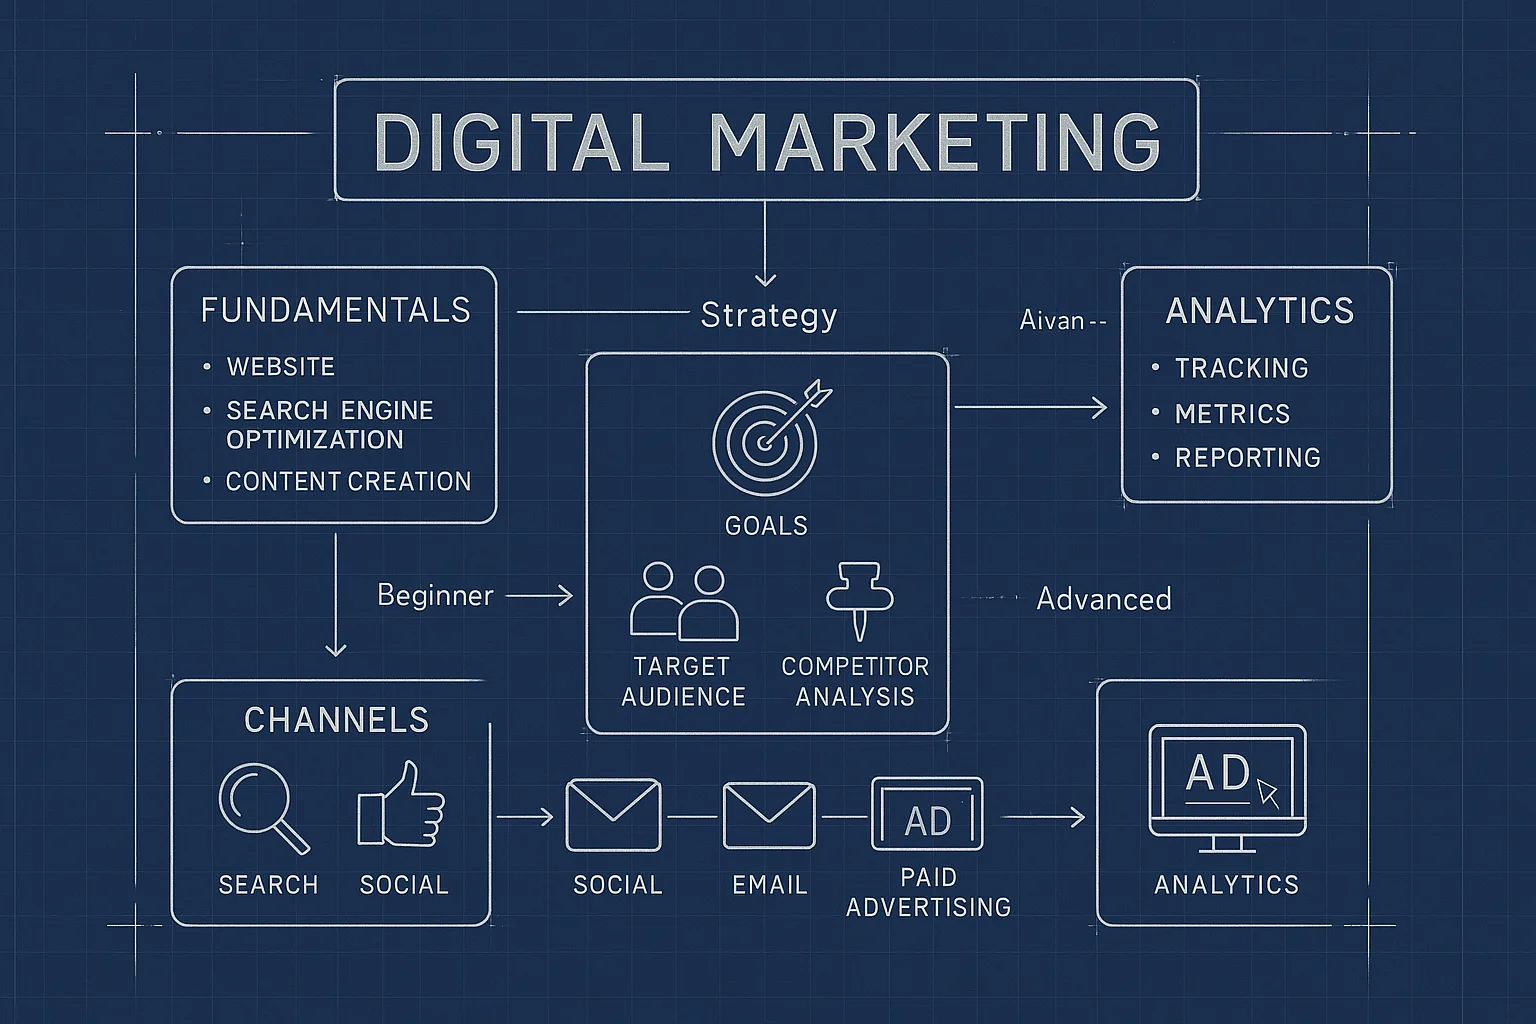
Blueprint
Topic: Digital Marketing, step-by-step framework, beginner to advanced progression.
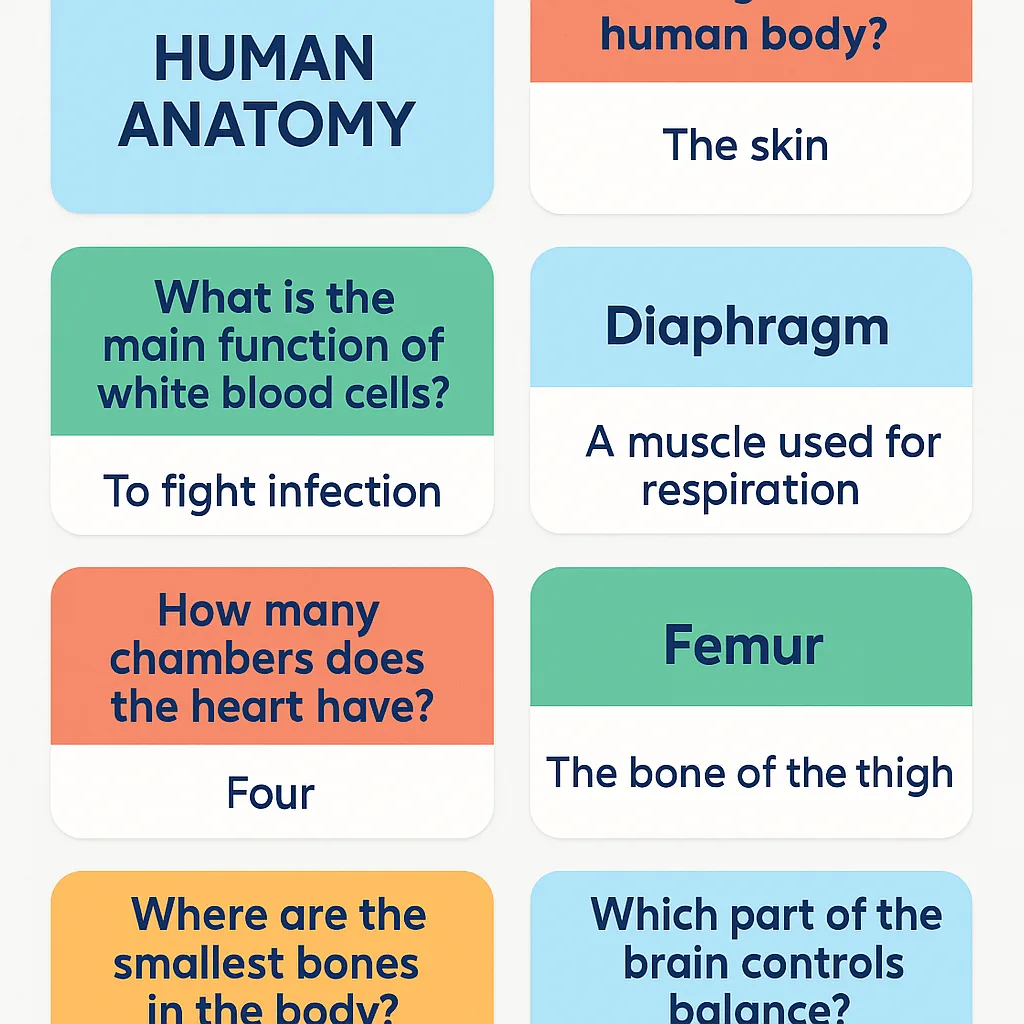
Flashcards
Topic: Human Anatomy, term/question and answer, laid out as a card grid.
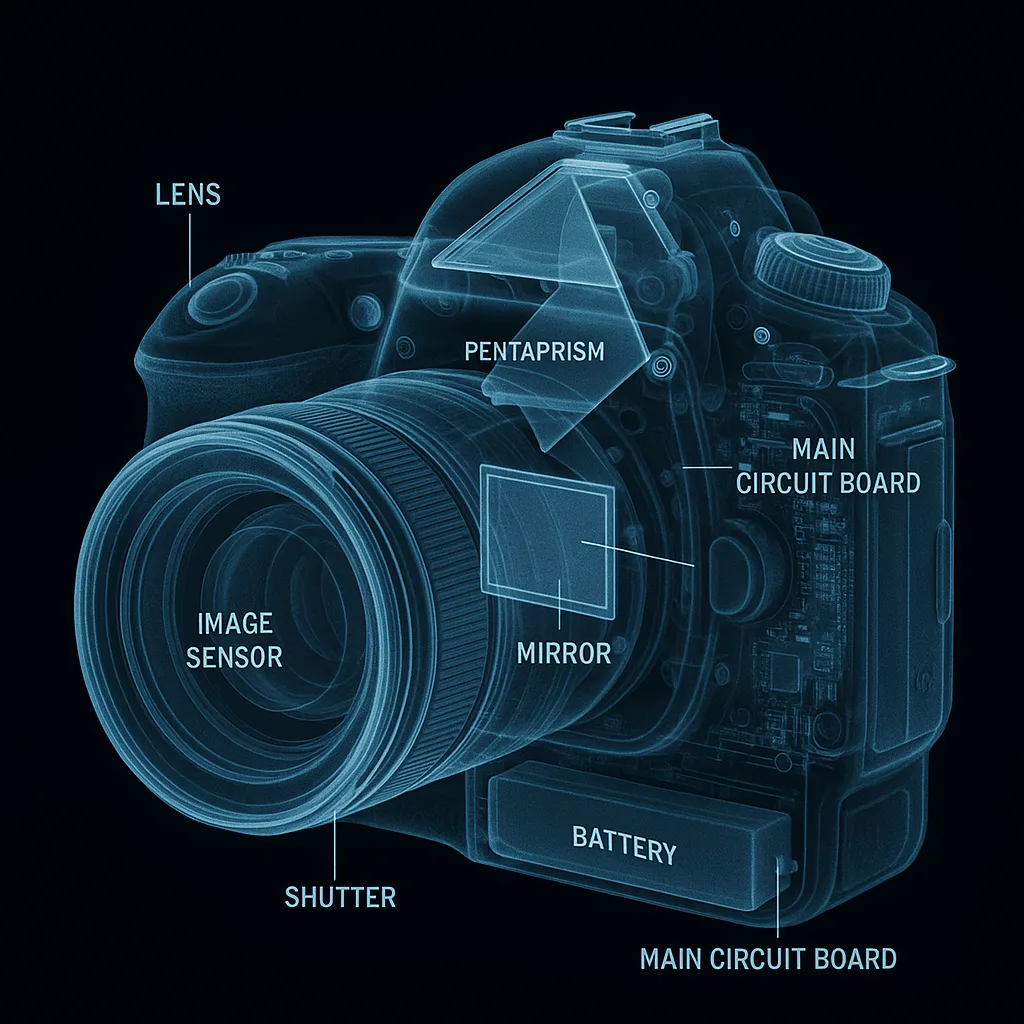
X-Ray
Topic: DSLR Camera, radiographic internal view, labeled components.
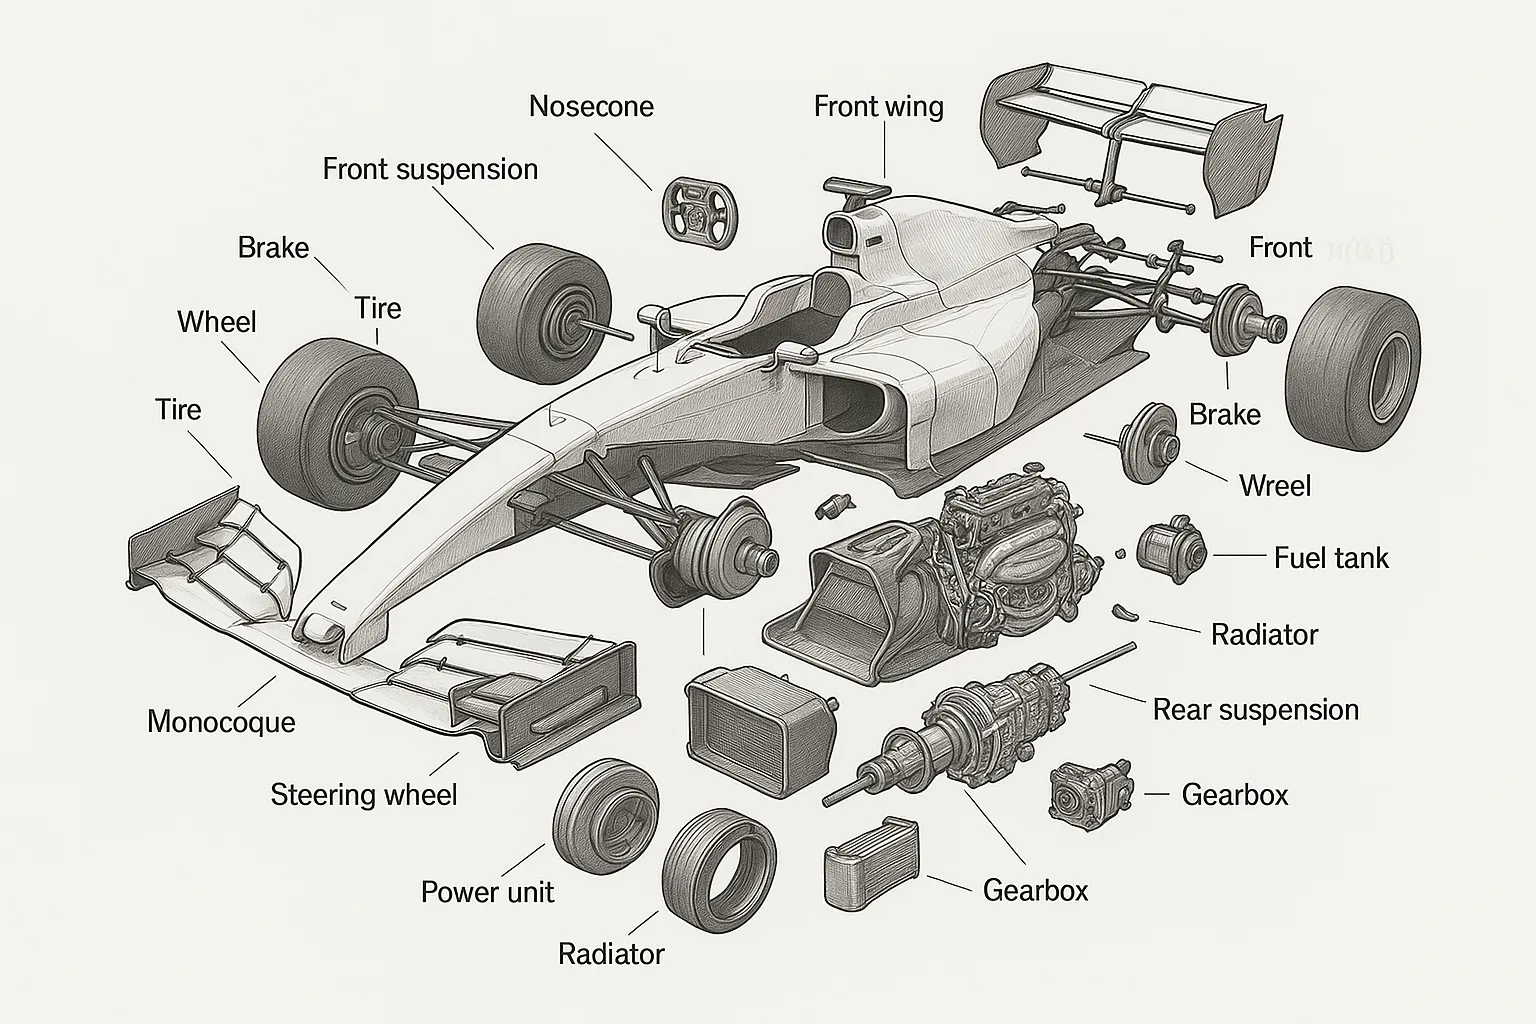
Exploded View
Topic: Formula 1 Car, every component separated along a central axis, labeled.
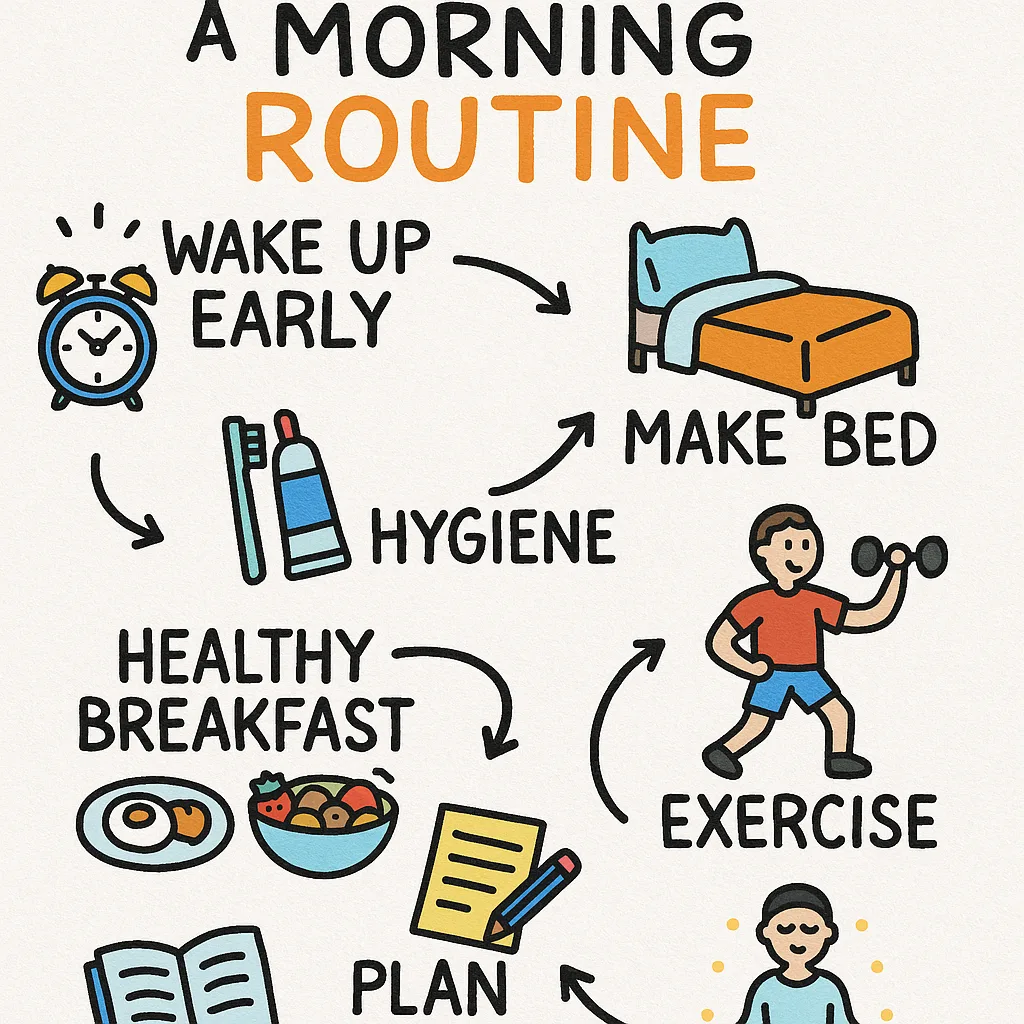
Sketchnote
Topic: Building a Morning Routine, hand-lettered headers, doodles, playful layout.
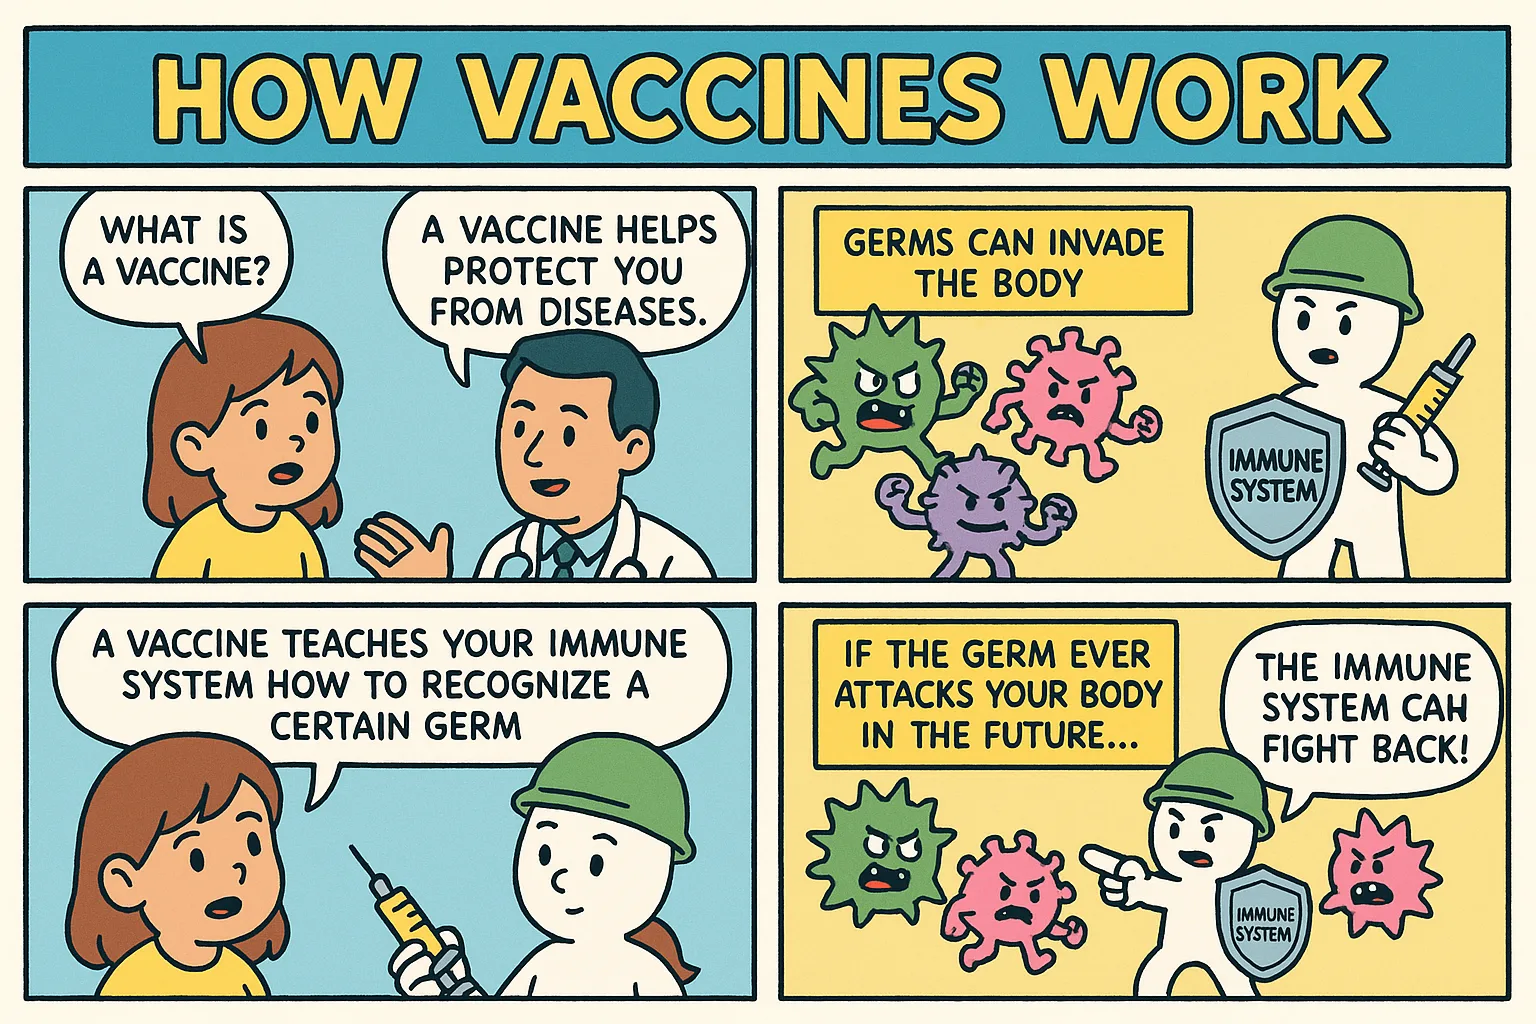
Comic Explainer
Topic: How Vaccines Work, a 4-6 panel comic strip with dialogue and captions.
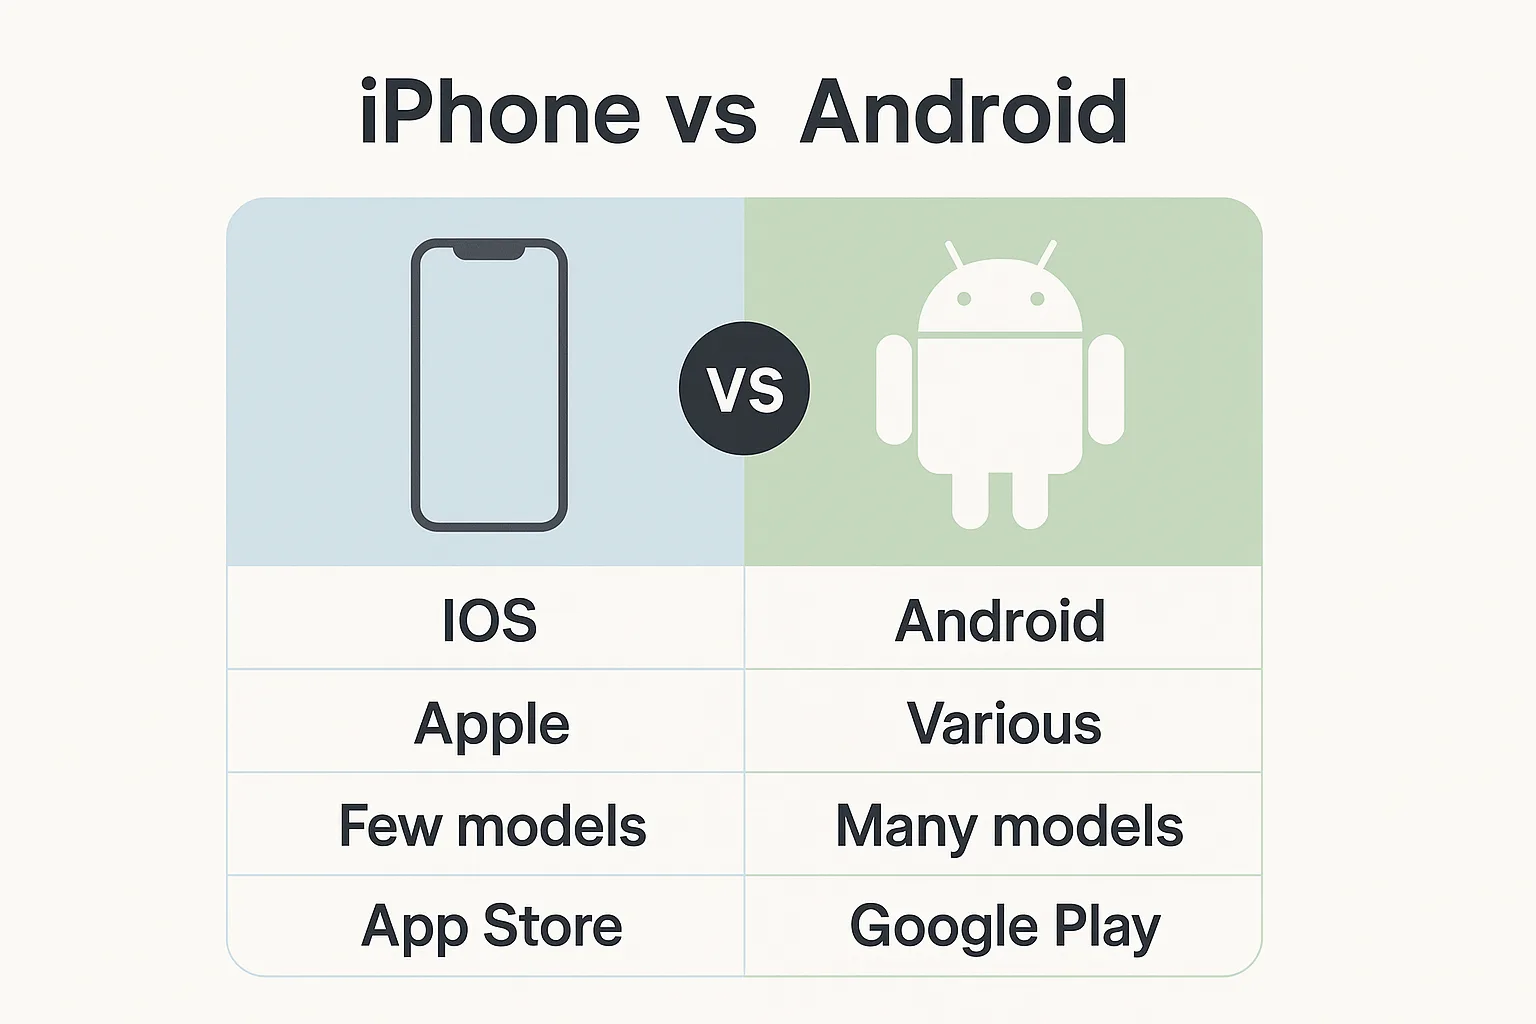
Compare (A vs B)
Topic: iPhone vs Android, matched rows for each comparison point.
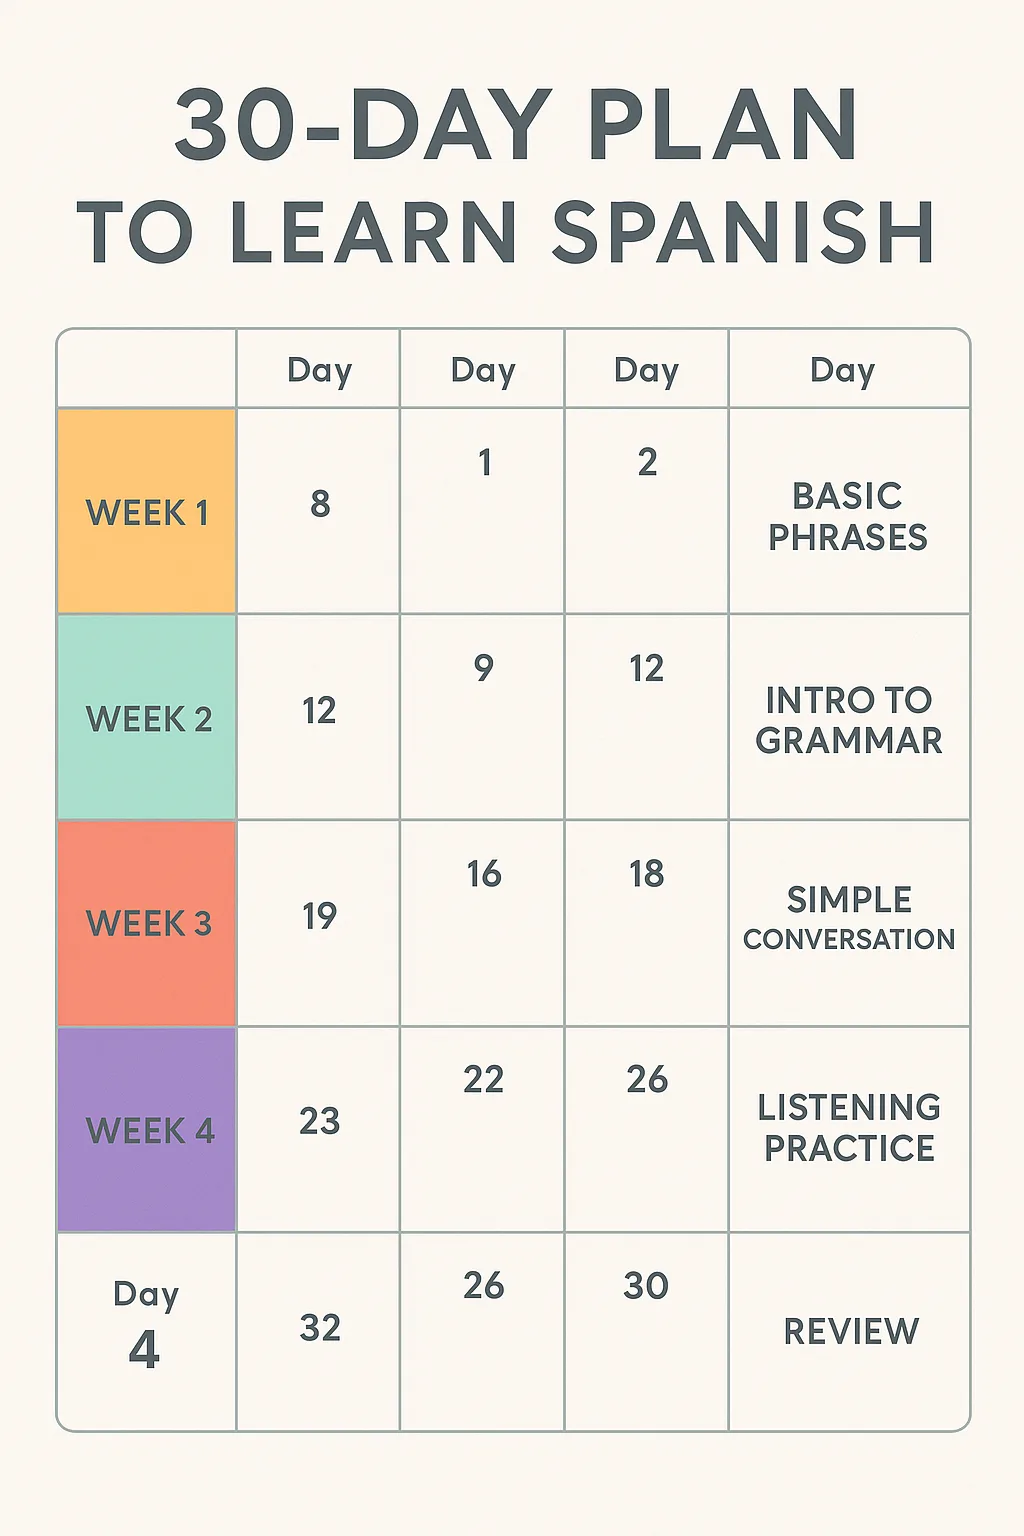
30-Day Plan
Topic: Learn Spanish, weekly blocks, milestones, day-by-day structure.
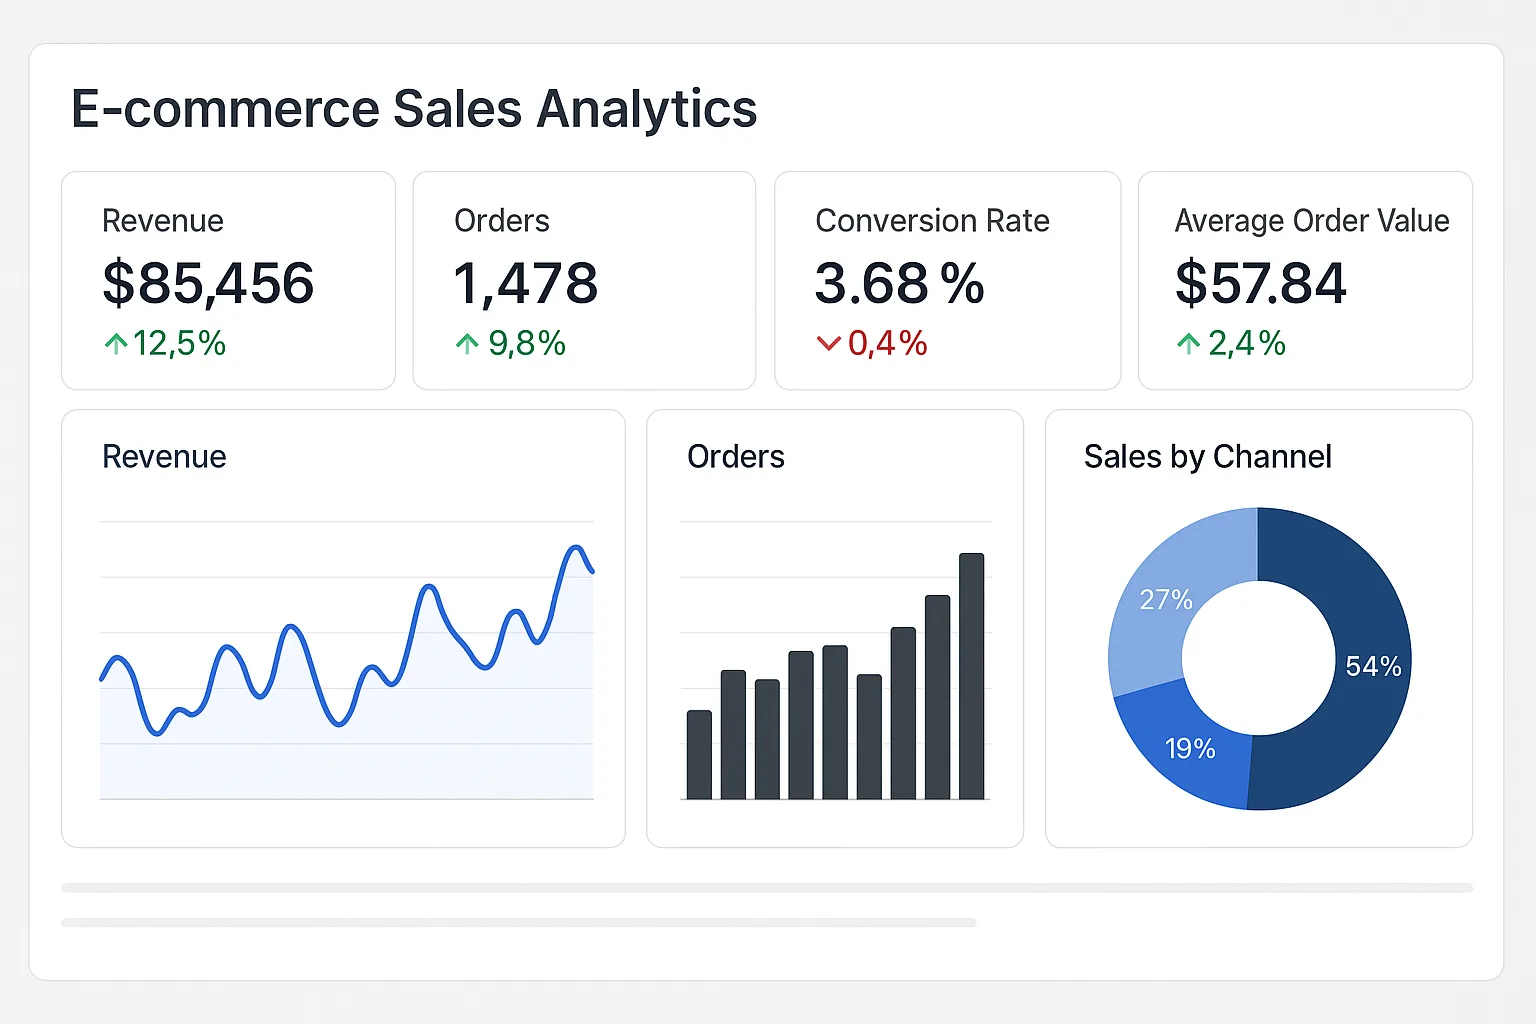
Dashboard
Topic: E-commerce Sales Analytics, metric tiles with trend arrows, plus supporting mini-charts.
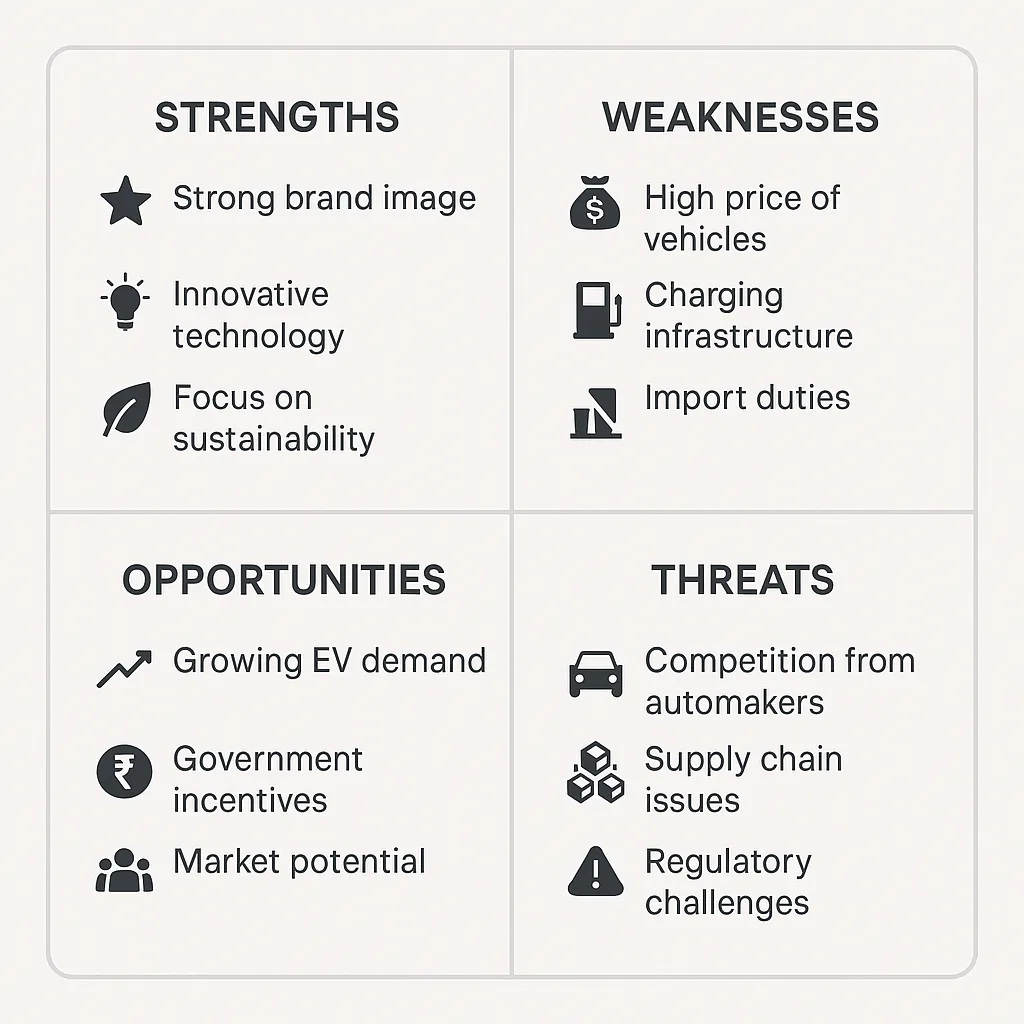
SWOT Analysis
Topic: Tesla entering the Indian market, Strengths, Weaknesses, Opportunities, Threats in four quadrants.